Published in K. Matějka, ed., Investigation of the Forest Ecosystems and of Forest Damage. Praha, 1995, p. 95-106
Bioindication of Nutrition State and Pollution on the Base of Foliar Analysis
Karel Matějka
Abstract
An analyse and evaluation of results of the chemical analysis of the Norway spruce (Picea abies) needles was matter of attention. The samples of 1st to 4th needle-year-classes (NYCs) were taken in the area of Czech Republic. Mutual relations among elements were studied using a multivariate ordination technique. There is evidence on different behaviour of 1st and 2nd NYCs comparing 3rd and 4th ones.
Keywords
air pollution, bioindication, foliar analysis, heavy metals, ICP-Forests, mineral elements, monitoring, multivariate analysis, nutrients, Picea abies (L.) KARSTEN
Comment
The used analyses in this paper were financially supported by the Ministry of Agriculture of the Czech Republic. Samples of needles were collected by Mr. Martin Černý with co-workers. Chemical analyses were provided by State Checking and Testing Institute in Agriculture in Brno.
Introduction
The concentration of single elements or the ratios of two elements are a matter of interest traditionally (e.g. Steffan, 1989, 1991; Dmuchowski, Bytnerowicz, 1994; Buchmann, Oren, Zimmermann, 1994). The most recent results of monitoring on the basis of foliar analysis have been published in the region of Czech Republic (West Bohemia prevails) by Skuhravý et al. (1995) and in Slovakia by Maňkovská (1995). Within the International co-operative programme Assessment and Monitoring of Air Pollution Effects on Forests (ICP-Forests; Matějka, 1993, 1994, 1995) nutrient state of the Norway spruce (Picea abies (L.) KARSTEN) young stands was estimated on the basis of foliar analysis.
The aim of this paper is to describe
One or two first needle-year-classes are used for investigation of nutrient supply usually (Aamlid, 1993; Stefan, 1989, 1991). It would be possible insufficient for some purposes as an indication of the pollution. The duration of material (needles) exposition is very important in the process of element accumulation. Regarding to the goals of this paper, total minerals content including matter on the needle surface was determined.
Methods
Needles were sampled from branches from the top third of crone in young Picea abies (L.) KARSTEN stands of surrounding of the ICP-Forests monitoring plots (8km-network, see Matějka, 1993). This part of crone should be full developed and sunny. The four youngest needle year classes were separated and dried. The milled samples were analysed according the total content of N, P, K, Ca, Mg, Na, Al, Fe, Mn, Zn, Cu, Pb, Cd and Cr.
Content of elements in the whole data set was described by computing medians rather than averages with relation to the non-normal distribution of the data.
Relations among elements were studied on the base of multivariate analysis. The data set was transformed by medians (x' = x/med). Principal component analysis (PCA) gives a picture about relation among elements in position of they in ordination space.
Results and discussion
Principal results are collected in Table 1. Distribution of a single element concentration in needles within the area of the Czech Republic is not very significant by the surveyed minerals. Distribution of the groups of plots according to the results of PCA is more meaningful (compare a description of the deposition zones on the basis of Pinus sylvestris L. needle analysis by Dmuchowski and Bytnerowicz, 1994). Relations between the element concentrations and three first axes of principal component analysis are visible in Tables 3 to 6.
The following regularities were observed:
Pb - Fe - Cr- Al - Cu
Cd - Mn - Zn - Ca - Mg
Only Cd is typical plant toxic metal in second series.
There is a similarity between transport Ca2+, Cd2+ and Zn2+ across cellular membrane (Rybová, Janáček, 1987). It would be a reason of the constitution of the element sere Cd-Mn-Zn-Ca.
An extreme high concentration values of Cd and Pb were determined on the basis of compare frequencies of this values with the normal distribution (method of analysis of a normal distribution contaminated with above-average values; see Table 8). With 95% probability, values equal or higher than 0.46 mg.kg-1 (Cd) or 2.16 mg.kg-1 (Pb) determine a significant pollution by these heavy metals. Equivalent analyse was made for sulphur.
There are some critical limits of concentration for many minerals (e.g. Maňkovská, 1995, Table 4), but meaning of these values is not clear very well comparing ones with average values in the samples from large areas (e.g. Na, Mn).
The observed changes in the minerals contents during growing old of needles are similar by the Norway spruce as by other coniferous species (compare situation by Pinus mugo being described by Skuhravý, Brewer, 1992, and Brewer, Skuhravý, Hrubík, 1994, for instance).
Regarding to the other results (Markert, 1992; Markert, Wtorova, 1992), determination of next elements would be necessary for a detail investigation of minerals in Norway spruce needles:
(elements are grouped according to concentration levels in the spruce needles).
The area of Czech Republic is divided into following regions according to the results of PCA:
Four regions with the * mark are potentially very difficult for monitoring of nutrient supply and / or pollution.
Conclusions
The monitoring of pollution by foliar analysis of Norway spruce is necessary to provide using 3rd or 4th needle-year-class. It is necessary the element critical limits to define with more precision. Critical concentration of sulphur is 1770 mg.kg-1, cadmium 0.46 mg.kg-1 and lead 2.16 mg.kg-1.
Principal component analysis is very powerful method for study of a set of element concentrations in needles.
References
Aamlid, D., 1993: 7. Needle analyses. Mineral nutrition of Norway spruce needles at permanent research plots of the Norwegian monitoring programme for forest damage. Analyses in 1986 compared to analyses in 1991. In: M.G. Thomsen, Ed., Proceedings from the meeting in the SNS-ad hoc group on monitoring of forest damage, 26.-28.4 1993, Ĺs, Norway. Ĺs p. 54-60.
Brewer, J.W., Skuhravý, V., Hrubík, P., 1994: Levels of major foliar chemicals in needles of Pinus mugo in Bohemian peatbogs. Ekológia (Bratislava), 13: 235-246.
Buchmann, N., Oren, R., Zimmermann, R., 1994: Response of magnesium-deficient samplings in a young open stand of Picea abies (L.)KARST to elevated soil magnesium, nitrogen and carbon. Environmental Pollution, 87: 31-43.
Dmuchowski, W., Bytnerowicz, A., 1994: Monitoring environmental pollution in Poland by chemical analysis of Scots pine (Pinus sylvestris L.) needles. Environmental Pollution, 87: 87-104.
Maňkovská, B., 1995: Mapping of forest environment load by selected elements through the leaf analyses. Ekológia (Bratislava), 14: 205-213.
Markert, B., 1992: Presence and significance of naturally occurring chemical elements of the periodic system in the plant organism and consequences for future investigations on inorganic environmental chemistry in ecosystems. Vegetatio, 103: 1-30.
Markert, B, Wtorova, W., 1992: Inorganic chemical investigations in the Forest Biosphere Reserve near Kalinin, USSR. Vegetatio, 98: 43-58.
Matějka, K., 1993: Monitoring stavu lesů České republiky. Metodický komentář, seznam ploch a některé dosavadní výsledky. VÚLHM Jíloviště-Strnady, Praha, 68 pp.
Matějka, K., 1994: Monitoring of the forest status in the Czech Republic. Recent results and prospects. In: K. Matějka, Ed., Investigation of the forest ecosystems and of forest danage. Praha, p. 146-154.
Matějka, K., 1995: Forest conditions under the air-pollution impact in Europe (Some results of the International Co-operative programme). Colloques Phytosociologiques, 23: 473-485.
Rybová, R., Janáček, K., 1987: Transport processes in the plants. (in Czech) Academia, Praha, 200 pp.
Skuhravý, V., Brewer, J.W., 1992: Heavy metals in needles of mountain and peatbog pines, Pinus mugo subsp. mughus SCOP. and P. mugo subsp. uncinata (ANT.) DOMIN in Bohemian peatbogs. Ekológia (ČSFR), Bratislava, 11: 3-11.
Skuhravý, V., Číhalík, J., Materna, J., Hrubík, P., 1995: Content of 16 heavy metals and other elements in spruce needles (1-4 years old) from 23 sites of the Czech Republic. Ekológia (Bratislava), 14: 323-330.
Stefan, K., 1989: Ergebnisse chemischer Nadelanalysen im untersuchungsgebiet Glein. Mitteilungen Forstl. Bundesversuchsanst. Wien, Vol. 163/2, p. 289-339.
Stefan, K., 1991: Zur Nährelementversorgung der Fichtennadeln von gedüngten und ungedüngten Bäumen in Gleinalmgebiet. Mitteilungen Forstl. Bundesversuchs-anst. Wien, Vol. 163/4, p. 65-140.
Table 1. Median values of the mineral element content in the Picea abies needles of various needle year classes (Czech Republic, 1991, young stands near the ICP-Forests monitoring plots) and limit values (optimal concentrations) of main nutrients according to Stefan (1991). Critical limits for other metals (Na to Cr) correspond to Maňkovská (1995). A compare with average values determined by Skuhravý et al. (1995) (23 plots in the Czech Republic; 1st and 4th needle-year-classes) and by Maňkovská (1995) (112 monitoring plots in Slovakia) has been provided.
year-class: |
1 |
2 |
3 |
4 |
limit value |
Skuhravý et al. (1995) 1st NYC |
Skuhravý et al. (1995) 4th NYC |
Maňkovská (1995) |
N 1) |
15.50 |
14.00 |
16.25 |
15.20 |
13.1-15.0 |
|
|
|
P 1) |
1.72 |
1.37 |
1.63 |
1.26 |
1.2-1.3 |
|
|
|
K 1) |
7.21 |
5.60 |
7.18 |
6.04 |
3.4-4.2 |
13.12 |
11.06 |
|
Ca 1) |
4.50 |
5.60 |
4.68 |
6.00 |
1.1-3.6 |
5.24 |
8.13 |
|
Mg 1) |
1.000 |
0.777 |
0.932 |
0.760 |
0.8-1.1 |
1.50 |
1.48 |
|
|
|
|
|
|
|
|
|
|
Na 2) |
120 |
129 |
101 |
120 |
30 |
114 |
189 |
|
Al 2) |
110 |
135 |
89.5 |
101 |
100 |
139 |
177 |
|
Fe 2) |
65 |
79 |
66.5 |
80 |
100 |
34 |
49 |
121 |
Mn 2) |
795 |
1005 |
1110 |
1480 |
100 |
1022 |
1302 |
773 |
Zn 2) |
34.3 |
33.0 |
30.2 |
25.5 |
50 |
40.3 |
47.6 |
102. |
Cu 2) |
3.64 |
2.80 |
3.60 |
2.70 |
10 |
6.73 |
8.18 |
9.21 |
Pb 2) |
0.86 |
1.16 |
1.20 |
1.60 |
6 |
1.67 |
2.77 |
4.66 |
Cd 2) |
0.20 |
0.19 |
0.25 |
0.17 |
0.5 |
0.27 |
2.29 |
1.51 |
Cr 2) |
0.5 |
0.5 |
0.6 |
0.5 |
0.2 |
|
|
1.45 |
1) mg.g-1 2) mg.kg-1
Table 2. The first four eigenvalues of correlation matrix among elements used by principal component analysis. Equivalent values were computed for four needle year classes.
year-class: |
1 |
2 |
3 |
4 |
number of samples |
243 |
219 |
98 |
89 |
λ |
0.298 |
0.258 |
0.319 |
0.266 |
λ2 |
0.181 |
0.175 |
0.194 |
0.220 |
λ3 |
0.110 |
0.116 |
0.152 |
0.130 |
λ4 |
0.095 |
0.107 |
0.096 |
0.121 |
Table 3. Averages and standard deviations of the element content in the spruce needles of 1st-year-class by samples divided into groups according to the results of PCA. r is correlation between element content and a PCA axis score. The sum of r-quadrates for first one to three PCA aces corresponds to a meaning of the element among other elements. All data are in mg.kg-1 except for nitrogen (mg.g-1).
PCA 1 |
n |
N |
P |
K |
Ca |
Mg |
Na |
Al |
Fe |
Mn |
Zn |
Cu |
Pb |
Cd |
Cr |
S |
n |
|
average |
(-∞;-50] |
24 |
20,3 |
1584 |
7701 |
6548 |
1126 |
184,8 |
218,4 |
242,7 |
2400 |
40,0 |
4,91 |
3,32 |
0,40 |
1,03 |
||
(-50;0] |
88 |
17,1 |
1810 |
7411 |
5572 |
1099 |
110,5 |
122,1 |
97,6 |
1364 |
50,2 |
4,21 |
1,44 |
0,41 |
0,66 |
1269 |
(42) |
|
(0;+50] |
66 |
16,4 |
1740 |
8053 |
5163 |
1189 |
132,9 |
151,3 |
72,2 |
664 |
61,2 |
3,85 |
1,06 |
0,20 |
0,45 |
1366 |
(39) |
|
(+50;+∞) |
65 |
13,3 |
1744 |
6809 |
4615 |
1012 |
222,1 |
156,0 |
52,7 |
238 |
38,1 |
3,39 |
1,28 |
0,23 |
0,16 |
1194 |
(53) |
|
correlation |
r |
243 |
-0,524 |
0,080 |
-0,107 |
-0,138 |
-0,048 |
0,138 |
-0,064 |
-0,448 |
-0,778 |
0,007 |
-0,339 |
-0,276 |
-0,093 |
-0,724 |
-0,060 |
(137) |
st.deviation |
(-∞;-50] |
3,5 |
239 |
2441 |
2084 |
472 |
84,6 |
218,5 |
243,8 |
970 |
17,3 |
1,74 |
2,57 |
0,24 |
0,43 |
|||
(-50;0] |
3,5 |
361 |
1847 |
4672 |
435 |
45,1 |
71,5 |
105,0 |
574 |
54,3 |
1,48 |
1,18 |
1,47 |
0,30 |
396 |
|||
(0;+50] |
3,8 |
473 |
2461 |
3710 |
783 |
90,6 |
115,8 |
30,3 |
367 |
72,4 |
1,47 |
2,00 |
0,14 |
0,24 |
582 |
|||
(+50;+∞) |
2,3 |
346 |
1326 |
2361 |
180 |
362,3 |
92,8 |
16,2 |
145 |
20,1 |
0,58 |
2,57 |
0,12 |
0,15 |
284 |
|||
PCA 2 |
n |
N |
P |
K |
Ca |
Mg |
Na |
Al |
Fe |
Mn |
Zn |
Cu |
Pb |
Cd |
Cr |
S |
n |
|
average |
(-∞;-50] |
14 |
13,8 |
1885 |
6650 |
4307 |
1032 |
104,5 |
115,4 |
57,6 |
1101 |
114,8 |
3,25 |
0,30 |
0,14 |
0,59 |
1218 |
(14) |
(-50;0] |
92 |
15,7 |
1856 |
7436 |
4860 |
965 |
102,0 |
124,9 |
68,0 |
1091 |
56,2 |
3,60 |
0,64 |
0,20 |
0,53 |
1255 |
(59) |
|
(0;+50] |
104 |
16,2 |
1705 |
7386 |
5032 |
1084 |
165,0 |
143,0 |
78,2 |
877 |
36,1 |
3,90 |
1,41 |
0,40 |
0,45 |
1216 |
(51) |
|
(+50;+∞) |
33 |
18,6 |
1547 |
8053 |
7805 |
1578 |
283,7 |
246,4 |
224,7 |
905 |
41,0 |
5,48 |
4,53 |
0,33 |
0,56 |
1295 |
(13) |
|
correlation |
r |
243 |
0,238 |
-0,269 |
0,119 |
0,221 |
0,303 |
0,381 |
0,339 |
0,411 |
-0,123 |
-0,251 |
0,402 |
0,666 |
0,055 |
-0,017 |
0,180 |
(137) |
st.deviation |
(-∞;-50] |
1,8 |
383 |
2335 |
1997 |
197 |
67,7 |
44,9 |
10,9 |
429 |
115,2 |
0,54 |
0,22 |
0,10 |
0,36 |
449 |
||
(-50;0] |
3,4 |
365 |
1709 |
4482 |
242 |
47,6 |
97,5 |
33,6 |
799 |
61,6 |
1,13 |
0,35 |
0,13 |
0,30 |
358 |
|||
(0;+50] |
3,8 |
368 |
1672 |
2504 |
499 |
91,9 |
98,1 |
46,2 |
865 |
17,4 |
1,00 |
0,88 |
1,35 |
0,37 |
354 |
|||
(+50;+∞) |
4,8 |
394 |
3268 |
4155 |
861 |
490,7 |
168,3 |
255,3 |
851 |
15,6 |
2,19 |
4,22 |
0,22 |
0,51 |
718 |
|||
PCA 3 |
n |
N |
P |
K |
Ca |
Mg |
Na |
Al |
Fe |
Mn |
Zn |
Cu |
Pb |
Cd |
Cr |
S |
n |
|
average |
(-∞;-50] |
25 |
18,2 |
1812 |
9316 |
7349 |
1630 |
153,2 |
241,8 |
194,6 |
1183 |
70,0 |
4,91 |
1,89 |
0,08 |
0,59 |
497 |
(14) |
(-50;0] |
96 |
16,6 |
1814 |
7617 |
5267 |
1114 |
143,4 |
176,2 |
96,3 |
867 |
61,8 |
4,18 |
1,31 |
0,17 |
0,55 |
702 |
(57) |
|
(0;+50] |
115 |
15,4 |
1699 |
6941 |
4859 |
985 |
165,9 |
110,0 |
69,6 |
994 |
34,2 |
3,57 |
1,48 |
0,32 |
0,45 |
538 |
(62) |
|
(+50;+∞) |
7 |
17,0 |
1529 |
6962 |
5737 |
997 |
97,6 |
71,7 |
71,4 |
1405 |
38,5 |
4,00 |
2,17 |
2,55 |
0,47 |
423 |
(3) |
|
correlation |
r |
243 |
-0,201 |
-0,174 |
-0,296 |
-0,218 |
-0,344 |
-0,010 |
-0,431 |
-0,273 |
0,012 |
-0,278 |
-0,330 |
-0,003 |
0,374 |
-0,146 |
-0,189 |
(137) |
st.deviation |
(-∞;-50] |
4,8 |
492 |
2985 |
4057 |
900 |
71,3 |
193,5 |
239,1 |
954 |
57,3 |
2,15 |
3,35 |
0,08 |
0,36 |
587 |
||
(-50;0] |
4,2 |
374 |
2010 |
4891 |
528 |
100,0 |
120,6 |
110,7 |
747 |
72,6 |
1,54 |
1,67 |
0,09 |
0,44 |
664 |
|||
(0;+50] |
3,1 |
361 |
1499 |
2131 |
291 |
276,5 |
57,7 |
42,7 |
843 |
12,5 |
0,81 |
2,08 |
0,16 |
0,30 |
792 |
|||
(+50;+∞) |
4,9 |
322 |
1653 |
1346 |
151 |
46,6 |
26,3 |
29,5 |
768 |
8,7 |
1,39 |
1,38 |
4,68 |
0,34 |
599 |
|||
Sum r2 |
N |
P |
K |
Ca |
Mg |
Na |
Al |
Fe |
Mn |
Zn |
Cu |
Pb |
Cd |
Cr |
S |
|||
1 |
0,275 |
0,006 |
0,011 |
0,019 |
0,002 |
0,019 |
0,004 |
0,201 |
0,605 |
0,000 |
0,115 |
0,076 |
0,009 |
0,524 |
0,004 |
|||
2 |
0,331 |
0,079 |
0,026 |
0,068 |
0,094 |
0,164 |
0,119 |
0,370 |
0,620 |
0,063 |
0,277 |
0,520 |
0,012 |
0,524 |
0,036 |
|||
3 |
0,372 |
0,109 |
0,113 |
0,115 |
0,212 |
0,164 |
0,305 |
0,444 |
0,621 |
0,140 |
0,385 |
0,520 |
0,152 |
0,546 |
0,072 |
Table 4. Averages and standard deviations of the element content in the spruce needles of 2nd-year-class by samples divided into groups according to the results of PCA. r is correlation between element content and a PCA axis score. The sum of r-quadrates for first one to three PCA aces corresponds to a meaning of the element among other elements. All data are in mg.kg-1 except for nitrogen (mg.g-1).
PCA 1 |
n |
N |
P |
K |
Ca |
Mg |
Na |
Al |
Fe |
Mn |
Zn |
Cu |
Pb |
Cd |
Cr |
S |
n |
|
average |
(-∞;-50] |
18 |
15,7 |
1254 |
5560 |
8034 |
745 |
160,6 |
104,4 |
85,1 |
2956 |
28,4 |
2,78 |
1,19 |
0,26 |
0,89 |
1315 |
(5) |
(-50;0] |
95 |
15,6 |
1387 |
6064 |
6612 |
868 |
129,9 |
152,1 |
111,5 |
1861 |
54,2 |
3,93 |
1,58 |
0,29 |
0,68 |
1319 |
(41) |
|
(0;+50] |
51 |
14,5 |
1395 |
5961 |
5503 |
1107 |
124,7 |
232,5 |
89,4 |
697 |
49,4 |
10,67 |
2,01 |
0,17 |
0,51 |
1317 |
(29) |
|
(+50;+∞) |
54 |
11,3 |
1404 |
5537 |
5176 |
859 |
250,6 |
226,0 |
75,3 |
355 |
42,8 |
3,27 |
2,97 |
0,26 |
0,18 |
1170 |
(45) |
|
correlation |
r |
219 |
-0,518 |
0,083 |
-0,166 |
-0,370 |
0,031 |
0,182 |
0,201 |
-0,208 |
-0,757 |
0,012 |
0,038 |
0,274 |
-0,009 |
-0,616 |
-0,186 |
(120) |
st.deviation |
(-∞;-50] |
5,0 |
160 |
1115 |
2964 |
243 |
73,6 |
40,8 |
27,1 |
1290 |
11,5 |
1,02 |
1,24 |
0,19 |
0,42 |
424 |
||
(-50;0] |
2,6 |
281 |
1163 |
2432 |
966 |
67,7 |
135,1 |
58,9 |
868 |
62,4 |
10,88 |
1,28 |
0,55 |
0,37 |
466 |
|||
(0;+50] |
3,0 |
279 |
1430 |
2318 |
1542 |
64,7 |
388,4 |
41,6 |
434 |
49,0 |
55,77 |
2,85 |
0,11 |
0,24 |
403 |
|||
(+50;+∞) |
2,3 |
228 |
1055 |
1914 |
221 |
390,3 |
197,9 |
59,9 |
263 |
12,6 |
0,68 |
5,82 |
0,14 |
0,15 |
227 |
|||
PCA 2 |
n |
N |
P |
K |
Ca |
Mg |
Na |
Al |
Fe |
Mn |
Zn |
Cu |
Pb |
Cd |
Cr |
S |
n |
|
average |
(-∞;-50] |
30 |
16,2 |
1315 |
5935 |
6455 |
706 |
284,2 |
137,2 |
135,6 |
1768 |
35,9 |
3,47 |
6,75 |
0,39 |
0,68 |
1168 |
(6) |
(-50;0] |
81 |
15,2 |
1347 |
5971 |
5851 |
769 |
174,6 |
164,0 |
96,9 |
1396 |
34,4 |
7,93 |
1,81 |
0,31 |
0,53 |
1186 |
(33) |
|
(0;+50] |
82 |
12,9 |
1417 |
5784 |
5815 |
817 |
123,9 |
185,1 |
85,0 |
1008 |
51,3 |
4,21 |
0,93 |
0,19 |
0,49 |
1297 |
(59) |
|
(+50;+∞) |
26 |
13,3 |
1461 |
5718 |
7447 |
1890 |
98,0 |
309,2 |
74,4 |
1397 |
95,2 |
2,21 |
0,44 |
0,13 |
0,48 |
1312 |
(22) |
|
correlation |
r |
219 |
-0,377 |
0,178 |
-0,092 |
0,074 |
0,269 |
-0,227 |
0,180 |
-0,359 |
-0,173 |
0,351 |
-0,069 |
-0,551 |
-0,202 |
-0,169 |
0 |
(120) |
st.deviation |
(-∞;-50] |
3,3 |
239 |
1049 |
2421 |
230 |
510,6 |
88,3 |
83,2 |
1084 |
21,7 |
0,95 |
7,36 |
0,23 |
0,42 |
168 |
||
(-50;0] |
3,6 |
227 |
1102 |
2305 |
223 |
82,3 |
123,4 |
45,7 |
1206 |
26,7 |
44,40 |
0,88 |
0,58 |
0,32 |
319 |
|||
(0;+50] |
2,6 |
279 |
1397 |
2227 |
229 |
86,6 |
174,6 |
52,1 |
1010 |
51,1 |
11,68 |
0,44 |
0,11 |
0,44 |
428 |
|||
(+50;+∞) |
3,3 |
303 |
1155 |
3266 |
2617 |
46,9 |
539,6 |
20,8 |
633 |
76,2 |
0,62 |
0,31 |
0,09 |
0,22 |
356 |
|||
PCA 3 |
n |
N |
P |
K |
Ca |
Mg |
Na |
Al |
Fe |
Mn |
Zn |
Cu |
Pb |
Cd |
Cr |
S |
n |
|
average |
(-∞;-50] |
19 |
15,8 |
1348 |
6312 |
5362 |
714 |
143,7 |
127,0 |
105,6 |
1000 |
22,0 |
3,16 |
2,67 |
0,05 |
0,80 |
1040 |
(4) |
(-50;0] |
78 |
14,3 |
1386 |
5847 |
5173 |
1080 |
137,8 |
155,5 |
90,0 |
1188 |
31,0 |
2,80 |
2,12 |
0,16 |
0,51 |
1291 |
(44) |
|
(0;+50] |
114 |
13,9 |
1378 |
5839 |
6652 |
842 |
156,5 |
208,1 |
96,5 |
1361 |
60,8 |
7,42 |
1,81 |
0,28 |
0,50 |
1269 |
(68) |
|
(+50;+∞) |
8 |
15,6 |
1505 |
5376 |
9297 |
721 |
507,3 |
293,8 |
99,6 |
2282 |
95,9 |
3,03 |
1,79 |
1,21 |
0,58 |
1063 |
(4) |
|
correlation |
r |
219 |
-0,083 |
0,064 |
-0,142 |
0,361 |
0,000 |
0,131 |
0,143 |
-0,003 |
0,174 |
0,354 |
0,044 |
-0,045 |
0,541 |
-0,185 |
-0 |
(120) |
st.deviation |
(-∞;-50] |
2,8 |
227 |
1338 |
2354 |
199 |
52,4 |
42,7 |
28,7 |
906 |
15,1 |
1,19 |
3,16 |
0,03 |
0,68 |
128 |
||
(-50;0] |
3,3 |
262 |
1296 |
2163 |
1620 |
83,3 |
111,4 |
41,9 |
973 |
23,0 |
0,89 |
3,04 |
0,06 |
0,35 |
452 |
|||
(0;+50] |
3,5 |
263 |
1154 |
2377 |
234 |
92,6 |
294,4 |
67,1 |
1103 |
56,2 |
38,70 |
3,74 |
0,14 |
0,32 |
339 |
|||
(+50;+∞) |
2,7 |
315 |
845 |
2371 |
341 |
945,2 |
329,8 |
33,5 |
1697 |
68,4 |
0,67 |
1,41 |
1,61 |
0,33 |
233 |
|||
Sum r2 |
N |
P |
K |
Ca |
Mg |
Na |
Al |
Fe |
Mn |
Zn |
Cu |
Pb |
Cd |
Cr |
S |
|||
1 |
0,268 |
0,007 |
0,028 |
0,137 |
0,000 |
0,033 |
0,040 |
0,043 |
0,573 |
0,000 |
0,001 |
0,075 |
0,000 |
0,379 |
0,035 |
|||
2 |
0,410 |
0,039 |
0,036 |
0,142 |
0,073 |
0,085 |
0,073 |
0,172 |
0,603 |
0,123 |
0,006 |
0,379 |
0,041 |
0,408 |
0,052 |
|||
3 |
0,417 |
0,043 |
0,056 |
0,273 |
0,073 |
0,102 |
0,093 |
0,172 |
0,633 |
0,249 |
0,008 |
0,381 |
0,334 |
0,442 |
0,052 |
Table 5. Averages and standard deviations of the element content in the spruce needles of 3rd-year-class by samples divided into groups according to the results of PCA. r is correlation between element content and a PCA axis score. The sum of r-quadrates for first one to three PCA aces corresponds to a meaning of the element among other elements. All data are in mg.kg-1 except for nitrogen (mg.g-1).
PCA 1 |
n |
N |
P |
K |
Ca |
Mg |
Na |
Al |
Fe |
Mn |
Zn |
Cu |
Pb |
Cd |
Cr |
S |
n |
|
average |
(-∞;-50] |
19 |
14,9 |
1843 |
6694 |
4052 |
1045 |
73,9 |
82,4 |
52,9 |
874 |
33,4 |
3,38 |
0,43 |
0,18 |
0,45 |
1001 |
(13) |
(-50;0] |
24 |
16,7 |
1700 |
8088 |
5524 |
1790 |
99,3 |
76,7 |
65,5 |
1006 |
33,0 |
3,55 |
1,13 |
0,26 |
0,50 |
1351 |
(13) |
|
(0;+50] |
43 |
18,0 |
1609 |
7408 |
5238 |
1198 |
125,6 |
103,0 |
89,7 |
1610 |
30,4 |
4,25 |
2,05 |
0,30 |
0,95 |
|||
(+50;+∞) |
12 |
18,9 |
1548 |
7333 |
6050 |
1036 |
179,2 |
259,2 |
460,4 |
1629 |
40,0 |
4,82 |
4,13 |
0,46 |
1,37 |
|||
correlation |
r |
98 |
0,405 |
-0,347 |
0,065 |
0,297 |
-0,028 |
0,583 |
0,584 |
0,623 |
0,358 |
0,060 |
0,330 |
0,659 |
0,305 |
0,465 |
0,374 |
(26) |
st.deviation |
(-∞;-50] |
1,7 |
363 |
1666 |
1393 |
477 |
33,4 |
31,0 |
20,1 |
419 |
11,6 |
0,68 |
0,38 |
0,15 |
0,16 |
275 |
||
(-50;0] |
3,6 |
365 |
1934 |
2619 |
4111 |
48,6 |
20,5 |
19,5 |
594 |
12,9 |
1,29 |
0,63 |
0,14 |
0,19 |
565 |
|||
(0;+50] |
2,7 |
323 |
1846 |
2063 |
1537 |
40,5 |
33,9 |
36,2 |
979 |
10,1 |
1,85 |
1,57 |
0,20 |
0,87 |
||||
(+50;+∞) |
3,5 |
250 |
679 |
2933 |
351 |
78,5 |
241,5 |
470,8 |
1055 |
12,4 |
1,07 |
2,12 |
0,29 |
0,95 |
||||
PCA 2 |
n |
N |
P |
K |
Ca |
Mg |
Na |
Al |
Fe |
Mn |
Zn |
Cu |
Pb |
Cd |
Cr |
S |
n |
|
average |
(-∞;-50] |
4 |
15,9 |
1477,5 |
7450,0 |
5375,0 |
897,5 |
150,0 |
87,5 |
77,0 |
2198,5 |
35,7 |
4,3 |
1,2 |
0,8 |
0,6 |
||
(-50;0] |
43 |
16,5 |
1606,1 |
7037,7 |
5663,1 |
1013,3 |
116,3 |
94,6 |
81,0 |
1594,7 |
33,5 |
3,4 |
1,6 |
0,4 |
0,6 |
1145 |
(16) |
|
(0;+50] |
33 |
17,7 |
1786,8 |
7564,0 |
5229,1 |
1918,7 |
108,2 |
98,7 |
115,6 |
1190,3 |
34,7 |
4,3 |
1,6 |
0,2 |
0,9 |
1226 |
(12) |
|
(+50;+∞) |
18 |
18,3 |
1646,1 |
8100,0 |
3877,8 |
904,4 |
120,6 |
181,8 |
241,9 |
714,9 |
27,1 |
4,6 |
2,6 |
0,0 |
1,1 |
|||
correlation |
r |
98 |
0,167 |
0,038 |
0,160 |
-0,299 |
0,025 |
0,000 |
0,212 |
0,193 |
-0,456 |
-0,214 |
0,167 |
0,273 |
-0,725 |
0,164 |
0,036 |
(28) |
st.deviation |
(-∞;-50] |
0,6 |
110,3 |
934,1 |
1631,5 |
227,1 |
29,2 |
16,4 |
40,5 |
672,3 |
19,0 |
1,3 |
0,5 |
0,3 |
0,0 |
|||
(-50;0] |
3,0 |
292,7 |
1829,4 |
2273,2 |
370,5 |
62,8 |
56,0 |
59,1 |
1040,0 |
10,3 |
0,9 |
1,3 |
0,2 |
0,5 |
460 |
|||
(0;+50] |
3,6 |
364,8 |
1827,4 |
2524,7 |
3871,9 |
50,0 |
46,9 |
112,0 |
598,4 |
13,0 |
1,7 |
1,3 |
0,0 |
0,9 |
475 |
|||
(+50;+∞) |
2,7 |
405,0 |
1537,0 |
1489,4 |
198,8 |
53,7 |
206,9 |
435,2 |
452,5 |
8,4 |
2,1 |
2,7 |
0,0 |
0,9 |
||||
PCA 3 |
n |
N |
P |
K |
Ca |
Mg |
Na |
Al |
Fe |
Mn |
Zn |
Cu |
Pb |
Cd |
Cr |
S |
n |
|
average |
(-∞;-50] |
4 |
16,2 |
1590 |
7525 |
4800 |
967 |
100,0 |
84,7 |
54,9 |
1290 |
18,3 |
3,11 |
5,16 |
0,30 |
0,50 |
||
(-50;0] |
37 |
16,6 |
1604 |
7315 |
4731 |
945 |
112,2 |
80,9 |
72,0 |
1221 |
28,0 |
3,54 |
2,18 |
0,29 |
0,49 |
1321 |
(9) |
|
(0;+50] |
45 |
17,0 |
1658 |
7269 |
5062 |
981 |
113,7 |
113,7 |
136,4 |
1358 |
35,4 |
3,80 |
1,36 |
0,31 |
0,82 |
1037 |
(14) |
|
(+50;+∞) |
12 |
20,0 |
1935 |
8330 |
7110 |
3648 |
139,5 |
208,1 |
245,0 |
1503 |
42,8 |
6,29 |
0,84 |
0,21 |
1,73 |
1326 |
(5) |
|
correlation |
r |
98 |
0,251 |
0,318 |
0,127 |
0,279 |
0,322 |
0,152 |
0,436 |
0,365 |
0,097 |
0,454 |
0,512 |
-0,443 |
-0,102 |
0,519 |
-0,087 |
(28) |
st.deviation |
(-∞;-50] |
1,7 |
595 |
2063 |
2025 |
108 |
47,4 |
8,5 |
6,0 |
868 |
6,3 |
0,34 |
2,97 |
0,25 |
0,12 |
|||
(-50;0] |
2,3 |
277 |
1439 |
1758 |
170 |
34,8 |
19,4 |
33,8 |
825 |
7,7 |
0,95 |
1,29 |
0,20 |
0,19 |
561 |
|||
(0;+50] |
3,2 |
333 |
1700 |
2125 |
384 |
61,5 |
88,8 |
205,6 |
963 |
11,1 |
0,88 |
1,56 |
0,23 |
0,49 |
260 |
|||
(+50;+∞) |
4,2 |
362 |
2586 |
3373 |
6039 |
82,8 |
217,9 |
415,7 |
738 |
14,7 |
2,72 |
0,93 |
0,11 |
1,52 |
598 |
|||
Sum r2 |
N |
P |
K |
Ca |
Mg |
Na |
Al |
Fe |
Mn |
Zn |
Cu |
Pb |
Cd |
Cr |
S |
|||
1 |
0,164 |
0,120 |
0,004 |
0,088 |
0,000 |
0,340 |
0,341 |
0,388 |
0,128 |
0,004 |
0,109 |
0,434 |
0,093 |
0,216 |
0,140 |
|||
2 |
0,192 |
0,122 |
0,030 |
0,178 |
0,001 |
0,340 |
0,386 |
0,425 |
0,336 |
0,049 |
0,137 |
0,509 |
0,619 |
0,243 |
0,141 |
|||
3 |
0,255 |
0,223 |
0,046 |
0,255 |
0,105 |
0,363 |
0,576 |
0,559 |
0,346 |
0,256 |
0,399 |
0,705 |
0,629 |
0,512 |
0,149 |
Table 6. Averages and standard deviations of the element content in the spruce needles of 4th-year-class by samples divided into groups according to the results of PCA. r is correlation between element content and a PCA axis score. The sum of r-quadrates for first one to three PCA aces corresponds to a meaning of the element among other elements. All data are in mg.kg-1 except for nitrogen (mg.g-1).
PCA 1 |
n |
N |
P |
K |
Ca |
Mg |
Na |
Al |
Fe |
Mn |
Zn |
Cu |
Pb |
Cd |
Cr |
S |
n |
|
average |
(-∞;-50] |
9 |
15,2 |
1404,9 |
5565,0 |
5896,0 |
932,0 |
113,3 |
118,4 |
90,9 |
876,8 |
21,2 |
2,5 |
1,1 |
0,0 |
0,6 |
1262,5 |
(4) |
(-50;0] |
36 |
15,3 |
1353,1 |
6436,1 |
6255,6 |
777,7 |
111,4 |
95,2 |
81,7 |
1434,4 |
26,2 |
3,5 |
1,5 |
0,2 |
0,5 |
1212 |
(14) |
|
(0;+50] |
28 |
17,2 |
1266,3 |
6279,2 |
6046,5 |
775,2 |
151,7 |
109,3 |
122,1 |
2070,6 |
28,6 |
3,4 |
3,3 |
0,2 |
0,7 |
1085 |
(3) |
|
(+50;+∞) |
16 |
17,1 |
1161,7 |
6192,4 |
7614,4 |
762,1 |
193,3 |
167,4 |
277,8 |
2521,9 |
58,3 |
3,4 |
3,9 |
0,5 |
1,0 |
(1) |
||
correlation |
r |
0,336 |
-0,284 |
0,059 |
0,186 |
-0,089 |
0,547 |
0,428 |
0,615 |
0,438 |
0,305 |
0,080 |
0,288 |
0,693 |
0,505 |
-0,151 |
||
st.deviation |
(-∞;-50] |
2,1 |
318,7 |
1199,6 |
2561,8 |
250,6 |
52,1 |
42,2 |
41,1 |
492,0 |
5,5 |
0,4 |
1,3 |
0,0 |
0,3 |
|||
(-50;0] |
2,1 |
303,2 |
1488,6 |
2290,7 |
231,6 |
54,3 |
32,1 |
30,5 |
1073,9 |
12,7 |
4,7 |
0,9 |
0,0 |
0,3 |
||||
(0;+50] |
2,1 |
251,8 |
1353,7 |
2341,2 |
384,6 |
47,4 |
37,0 |
49,7 |
1191,8 |
15,0 |
1,8 |
5,2 |
0,1 |
0,2 |
||||
(+50;+∞) |
3,3 |
142,1 |
688,4 |
1781,3 |
144,0 |
45,3 |
97,6 |
225,8 |
1074,5 |
67,6 |
0,9 |
4,2 |
0,2 |
0,4 |
||||
PCA 2 |
n |
N |
P |
K |
Ca |
Mg |
Na |
Al |
Fe |
Mn |
Zn |
Cu |
Pb |
Cd |
Cr |
S |
n |
|
average |
(-∞;-50] |
6 |
15,4 |
1368,7 |
5497,2 |
8517,3 |
755,5 |
123,5 |
101,7 |
66,2 |
2395,3 |
74,7 |
2,1 |
0,7 |
0,3 |
0,4 |
1315 |
(4) |
(-50;0] |
38 |
15,4 |
1278,2 |
6065,5 |
7330,5 |
862,6 |
145,1 |
93,3 |
98,5 |
2124,8 |
34,2 |
3,7 |
1,4 |
0,3 |
0,6 |
1238 |
(13) |
|
(0;+50] |
27 |
16,5 |
1335,9 |
6385,4 |
5545,7 |
763,2 |
127,3 |
126,5 |
148,3 |
1524,0 |
23,9 |
2,9 |
2,0 |
0,2 |
0,7 |
1001 |
(5) |
|
(+50;+∞) |
18 |
17,8 |
1252,8 |
6711,1 |
5000,0 |
686,8 |
148,9 |
147,8 |
193,4 |
1199,7 |
26,4 |
3,5 |
5,8 |
0,1 |
0,9 |
|||
correlation |
r |
0,322 |
-0,119 |
0,255 |
-0,476 |
-0,193 |
0,009 |
0,348 |
0,322 |
-0,372 |
-0,239 |
0,064 |
0,518 |
-0,454 |
0,416 |
-0,264 |
||
st.deviation |
(-∞;-50] |
2,7 |
103,4 |
1577,6 |
2199,7 |
240,1 |
58,5 |
29,5 |
8,7 |
1761,7 |
105,6 |
0,4 |
0,6 |
0,1 |
0,2 |
|||
(-50;0] |
2,2 |
317,0 |
1412,8 |
2525,6 |
344,6 |
73,2 |
34,4 |
54,2 |
1219,1 |
18,3 |
4,8 |
0,8 |
0,2 |
0,3 |
||||
(0;+50] |
2,5 |
230,9 |
1082,0 |
1671,8 |
237,5 |
39,1 |
70,8 |
137,5 |
774,7 |
8,3 |
0,8 |
1,0 |
0,1 |
0,3 |
||||
(+50;+∞) |
2,4 |
280,7 |
1196,2 |
1071,3 |
144,4 |
45,8 |
64,7 |
185,1 |
1022,9 |
15,4 |
1,0 |
6,9 |
0,0 |
0,4 |
||||
PCA 3 |
n |
N |
P |
K |
Ca |
Mg |
Na |
Al |
Fe |
Mn |
Zn |
Cu |
Pb |
Cd |
Cr |
S |
n |
|
average |
(-∞;-50] |
8 |
17,4 |
1217,3 |
6275,0 |
6300,0 |
628,4 |
161,3 |
130,0 |
116,0 |
3661,8 |
20,6 |
2,7 |
1,5 |
0,1 |
0,9 |
||
(-50;0] |
36 |
16,4 |
1259,0 |
6204,9 |
6364,0 |
753,4 |
147,9 |
106,9 |
102,8 |
2243,3 |
23,8 |
3,5 |
2,3 |
0,2 |
0,7 |
1348 |
(5) |
|
(0;+50] |
36 |
16,3 |
1337,7 |
6433,8 |
6263,8 |
848,4 |
135,9 |
129,2 |
172,7 |
1147,5 |
34,4 |
3,5 |
3,1 |
0,3 |
0,7 |
1086 |
(10) |
|
(+50;+∞) |
9 |
14,1 |
1353,7 |
5720,8 |
7155,1 |
843,6 |
96,0 |
76,7 |
86,4 |
721,7 |
67,7 |
2,7 |
1,5 |
0,3 |
0,3 |
1252 |
(7) |
|
correlation |
r |
-0,317 |
0,204 |
-0,009 |
0,045 |
0,187 |
-0,254 |
-0,110 |
0,041 |
-0,727 |
0,325 |
-0,066 |
0,128 |
0,258 |
-0,299 |
-0,122 |
||
st.deviation |
(-∞;-50] |
1,8 |
170,2 |
1299,8 |
1905,3 |
138,2 |
29,3 |
35,0 |
59,2 |
1181,8 |
8,0 |
0,8 |
1,0 |
0,0 |
0,4 |
|||
(-50;0] |
2,4 |
261,3 |
1301,1 |
2629,3 |
206,5 |
53,9 |
48,8 |
99,8 |
1000,3 |
11,8 |
4,7 |
3,1 |
0,2 |
0,3 |
||||
(0;+50] |
2,6 |
317,1 |
1235,8 |
2159,9 |
347,4 |
68,0 |
69,5 |
156,1 |
649,3 |
16,8 |
1,8 |
4,6 |
0,2 |
0,4 |
||||
(+50;+∞) |
2,0 |
200,1 |
1630,0 |
1842,3 |
286,3 |
33,0 |
30,8 |
29,8 |
453,6 |
87,1 |
0,7 |
0,8 |
0,1 |
0,2 |
||||
Sum r2 |
N |
P |
K |
Ca |
Mg |
Na |
Al |
Fe |
Mn |
Zn |
Cu |
Pb |
Cd |
Cr |
S |
|||
1 |
0,113 |
0,081 |
0,003 |
0,035 |
0,008 |
0,299 |
0,183 |
0,378 |
0,192 |
0,093 |
0,006 |
0,083 |
0,480 |
0,255 |
0,023 |
|||
2 |
0,217 |
0,095 |
0,069 |
0,261 |
0,045 |
0,299 |
0,304 |
0,482 |
0,330 |
0,150 |
0,010 |
0,351 |
0,686 |
0,428 |
0,092 |
|||
3 |
0,317 |
0,136 |
0,069 |
0,263 |
0,080 |
0,364 |
0,316 |
0,484 |
0,859 |
0,256 |
0,015 |
0,368 |
0,753 |
0,517 |
0,107 |
Table 7. The most important elements for correlation structure expressed on the basis of correlation of each element with the three first ordination axes (values are sums r12+r22+r32). Four series represent four needle year classes.
1 |
|
2 |
|
3 |
|
4 |
|
Mn |
.621 |
Mn |
.633 |
Pb |
.705 |
Mn |
.859 |
Cr |
.546 |
Cr |
.442 |
Cd |
.629 |
Cd |
.753 |
Pb |
.520 |
N |
.417 |
Al |
.576 |
Cr |
.517 |
Fe |
.444 |
Pb |
.381 |
Fe |
.559 |
Fe |
.484 |
Cu |
.385 |
Cr |
.334 |
Cr |
.512 |
Pb |
.368 |
N |
.372 |
|
|
Cu |
.399 |
Na |
.364 |
Al |
.305 |
|
|
Na |
.363 |
N |
.317 |
|
|
|
|
Mn |
.346 |
Al |
.316 |
Table 8. An analyse of the higher concentrations of Cd, Pb and S in the Norway spruce needles of 1st year-class. Sets of values 1 (not contaminated) and 2 (contaminated) were distinguished using method of analysis of a normal distribution contaminated with above-average values. All values are in mg.kg-1.
|
|
Cd |
Pb |
S |
set 1 |
average |
0.26 |
1.19 |
1268 |
|
st. deviation |
0.12 |
0.59 |
301.0 |
set 2 |
average |
1.16 |
4.69 |
2189 |
|
st. deviation |
2.57 |
3.65 |
485.1 |
limit value |
|
0.46 |
2.16 |
1770 |
median |
|
0.20 |
0.86 |
1210 |
% higher values |
|
10.0 |
16.2 |
12.1 |
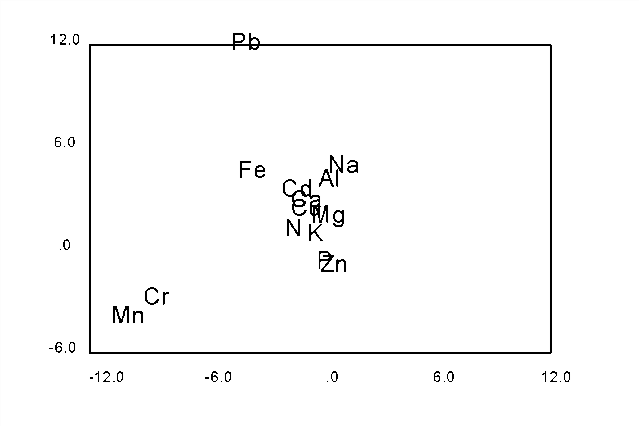
Fig. 1. Ordination of minerals contained in 1st needle-year-class.
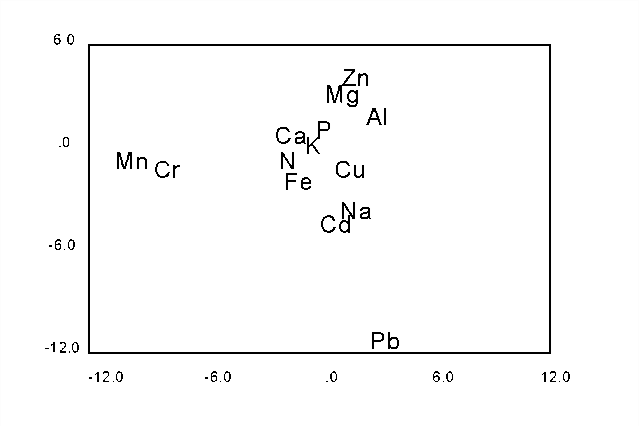
Fig. 2. Ordination of minerals contained in 2nd needle-year-class.
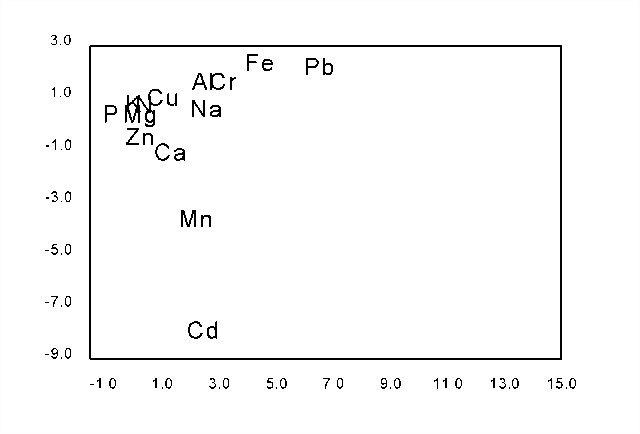
Fig. 3. Ordination of minerals contained in 3rd needle-year-class.
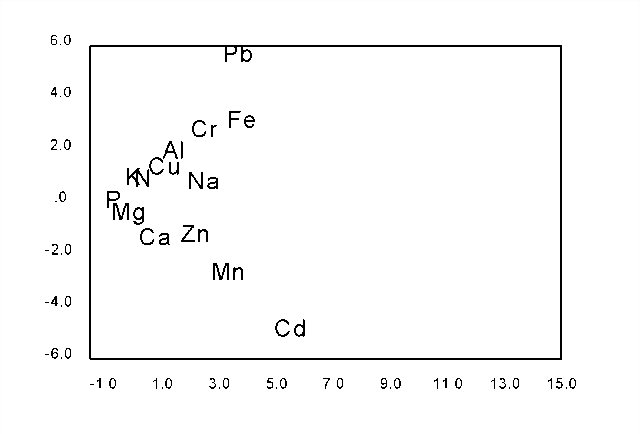
Fig. 4. Ordination of minerals contained in 4th needle-year-class.
Bioindikace stavu výživy a znečistění prostředí na základě listové analýzy
Pozornost byla věnována vyhodnocení výsledků listové analýzy vzorků jehlicí smrku (Picea abies). Odebrány byly vzorky 1. až 4. ročníku v roce 1991 na území České republiky. Základní výsledky jsou uvedeny v tabulkách. Zvláštní pozornost byla věnována porovnání vzájemných vztahů jednotlivých minerálních elementů v různých ročnících jehličí. Dokázán byl rozdílný charakter jejich obsahu v 1. a 2. ročníku, oproti 3. a 4. ročníku.
Zpět na hlavní stránku IDS
© Karel Matějka - IDS (2003)